Looking for Trends on Election Night? Watch These 4 Key Indicators
Exit poll data will offer early clues of the final outcome
OPINION — With the fog of political coverage you’re likely to see over the next week, I wanted to provide Roll Call readers with a simple how-to guide to identify important indicators on election night and what I will be focusing on as an election analyst when the first numbers begin to pour in.
You’ll hear a lot of commentary and even more speculation about the direction of the election and what specific races may mean. Here are four key indicators that can give you a good idea of how things are trending for both parties.
1. What does party ID look like?
The exit polls will give us the first sense of where self-defined party identification is trending. Will the electorate look more like a typical off-year, or will it show that one party’s turnout is higher than normal?
For instance, if we see a Democratic advantage around +7 in party ID, that would indicate an electorate that looks more like a presidential election year, similar to 2008. If party ID is much closer, ranging from even to a margin of 3, then the electorate will be closer to a typical off-year election (+2 D in 2006; even in 2010; +1 R in 2014). You have to go back over 30 years to the 1986 off-year election to find a Democratic party ID margin that was equivalent to recent presidential-year margins. Also, in that election, Republicans lost the Senate.
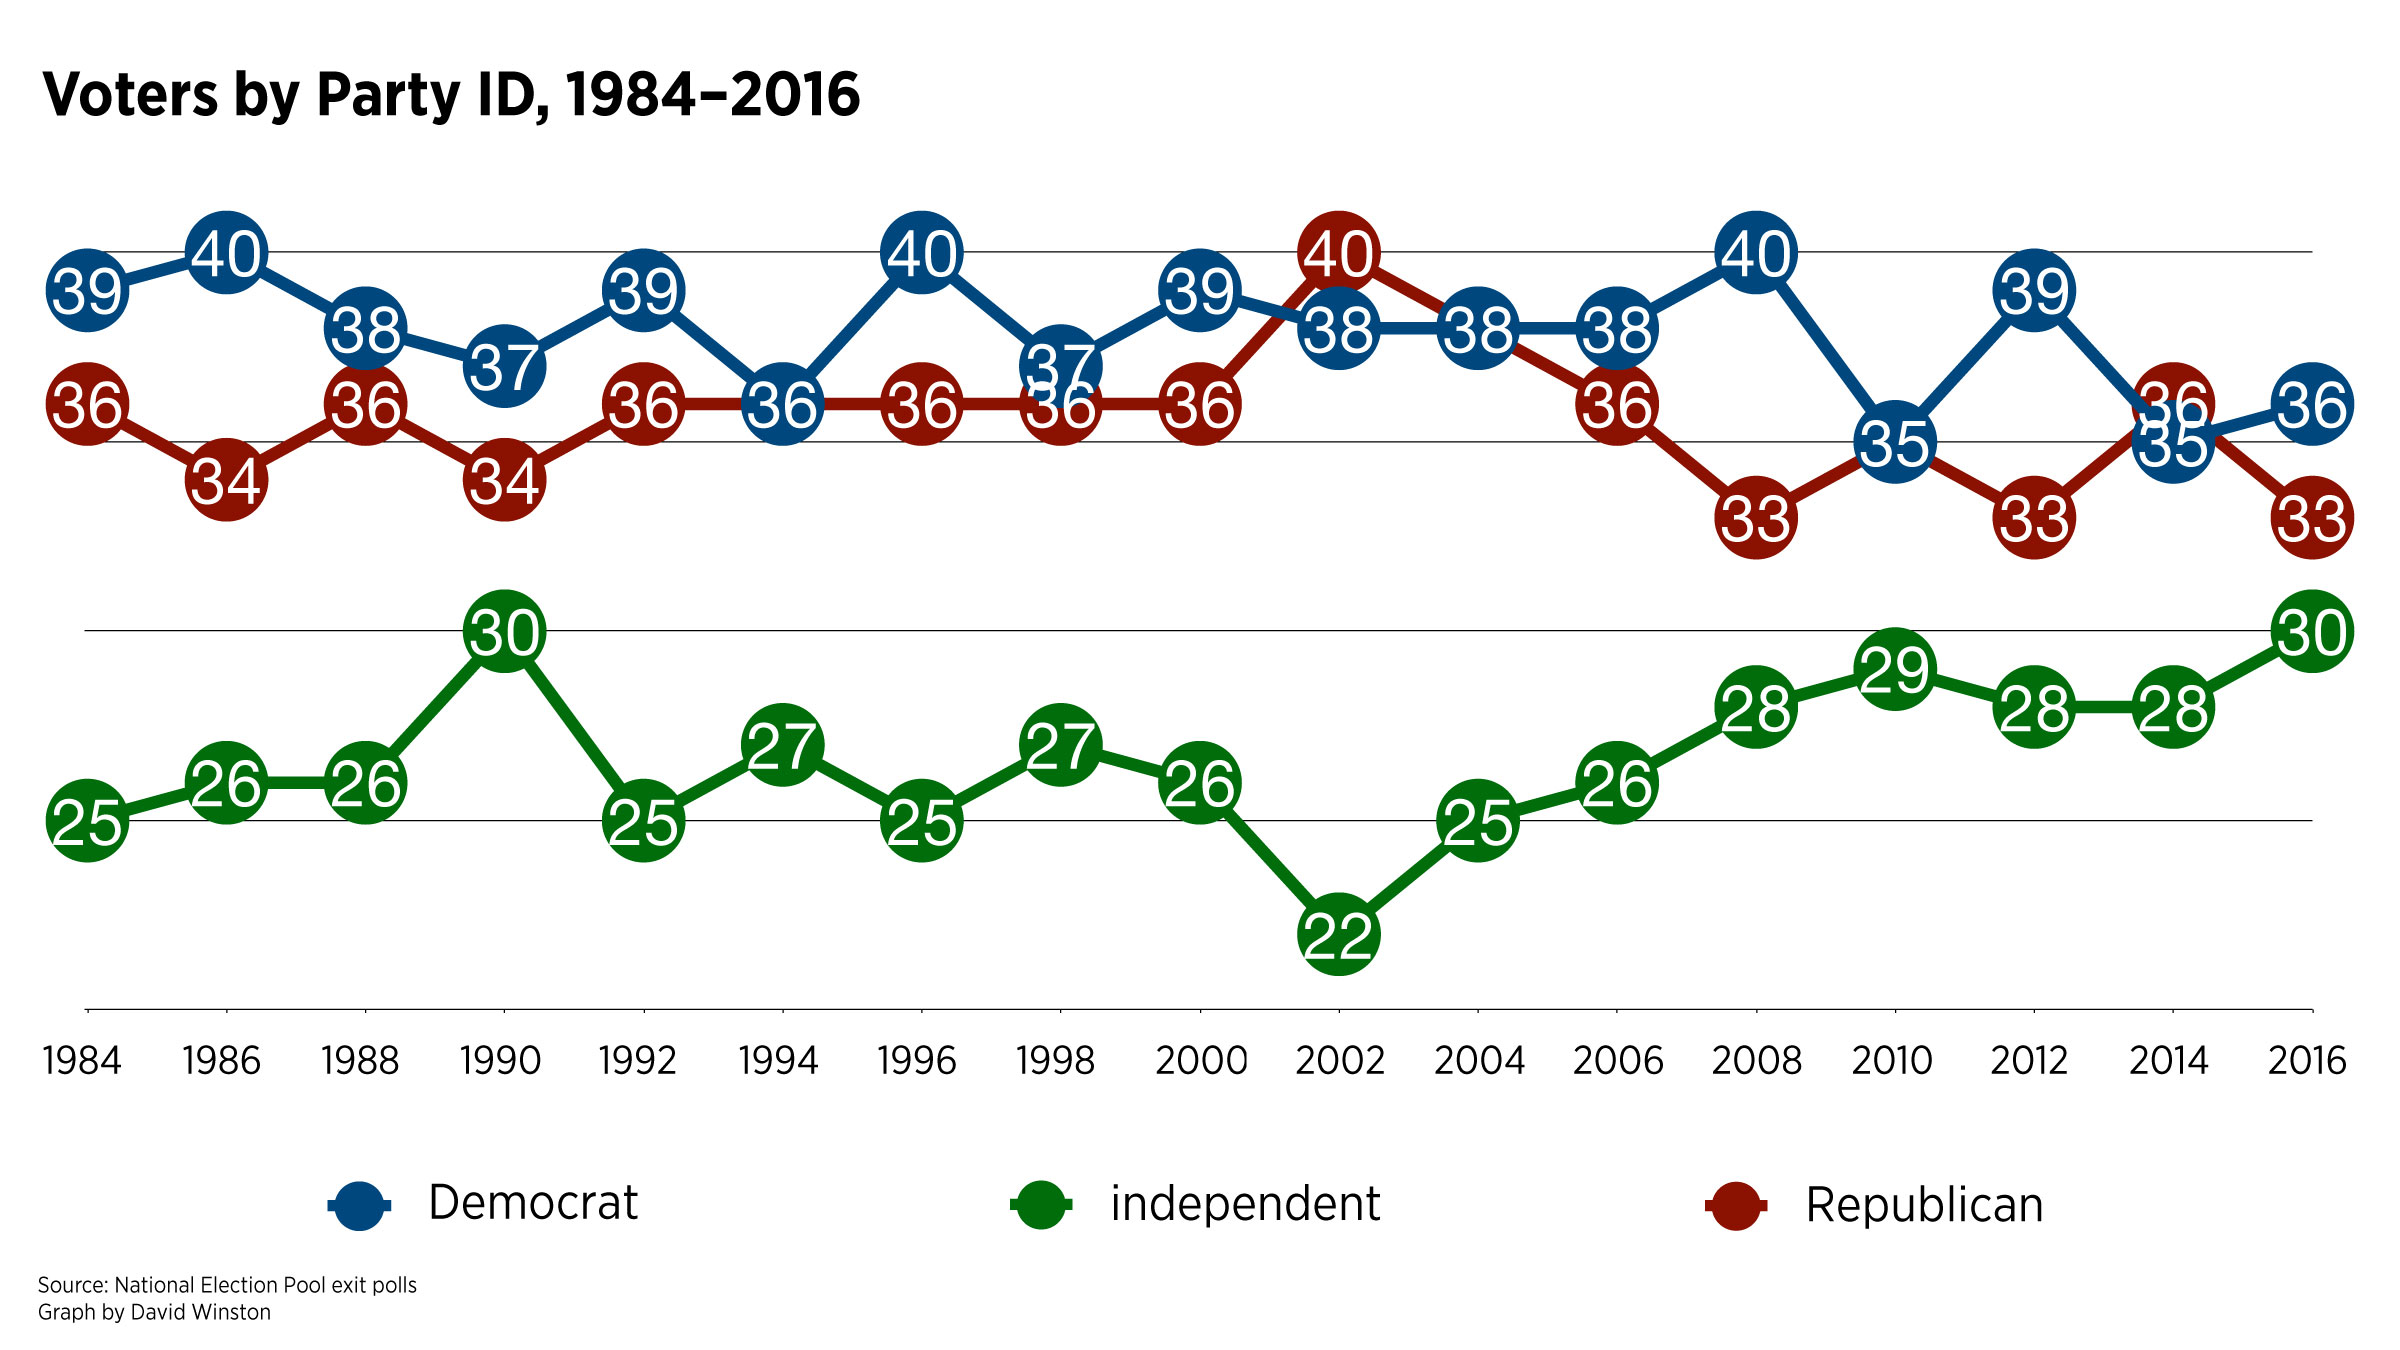
A note of caution: Some public surveys are showing a double-digit Democratic advantage in party ID. The data in these polls may mean we are about to see an unusual election result — say, a “blue wave.” But while these polls might be concerning to Republicans seven days out, without a better explanation of what is occurring among which groups to create this ahistorical result, one should not jump to premature conclusions when other polls are reporting significantly different results. That doesn’t mean the surveys are incorrect, just that when a survey is defining ahistorical results, a robust understanding of how the survey got to that conclusion is needed.
Also Watch: New Trump Ad Declares the Future ‘Isn’t Guaranteed’
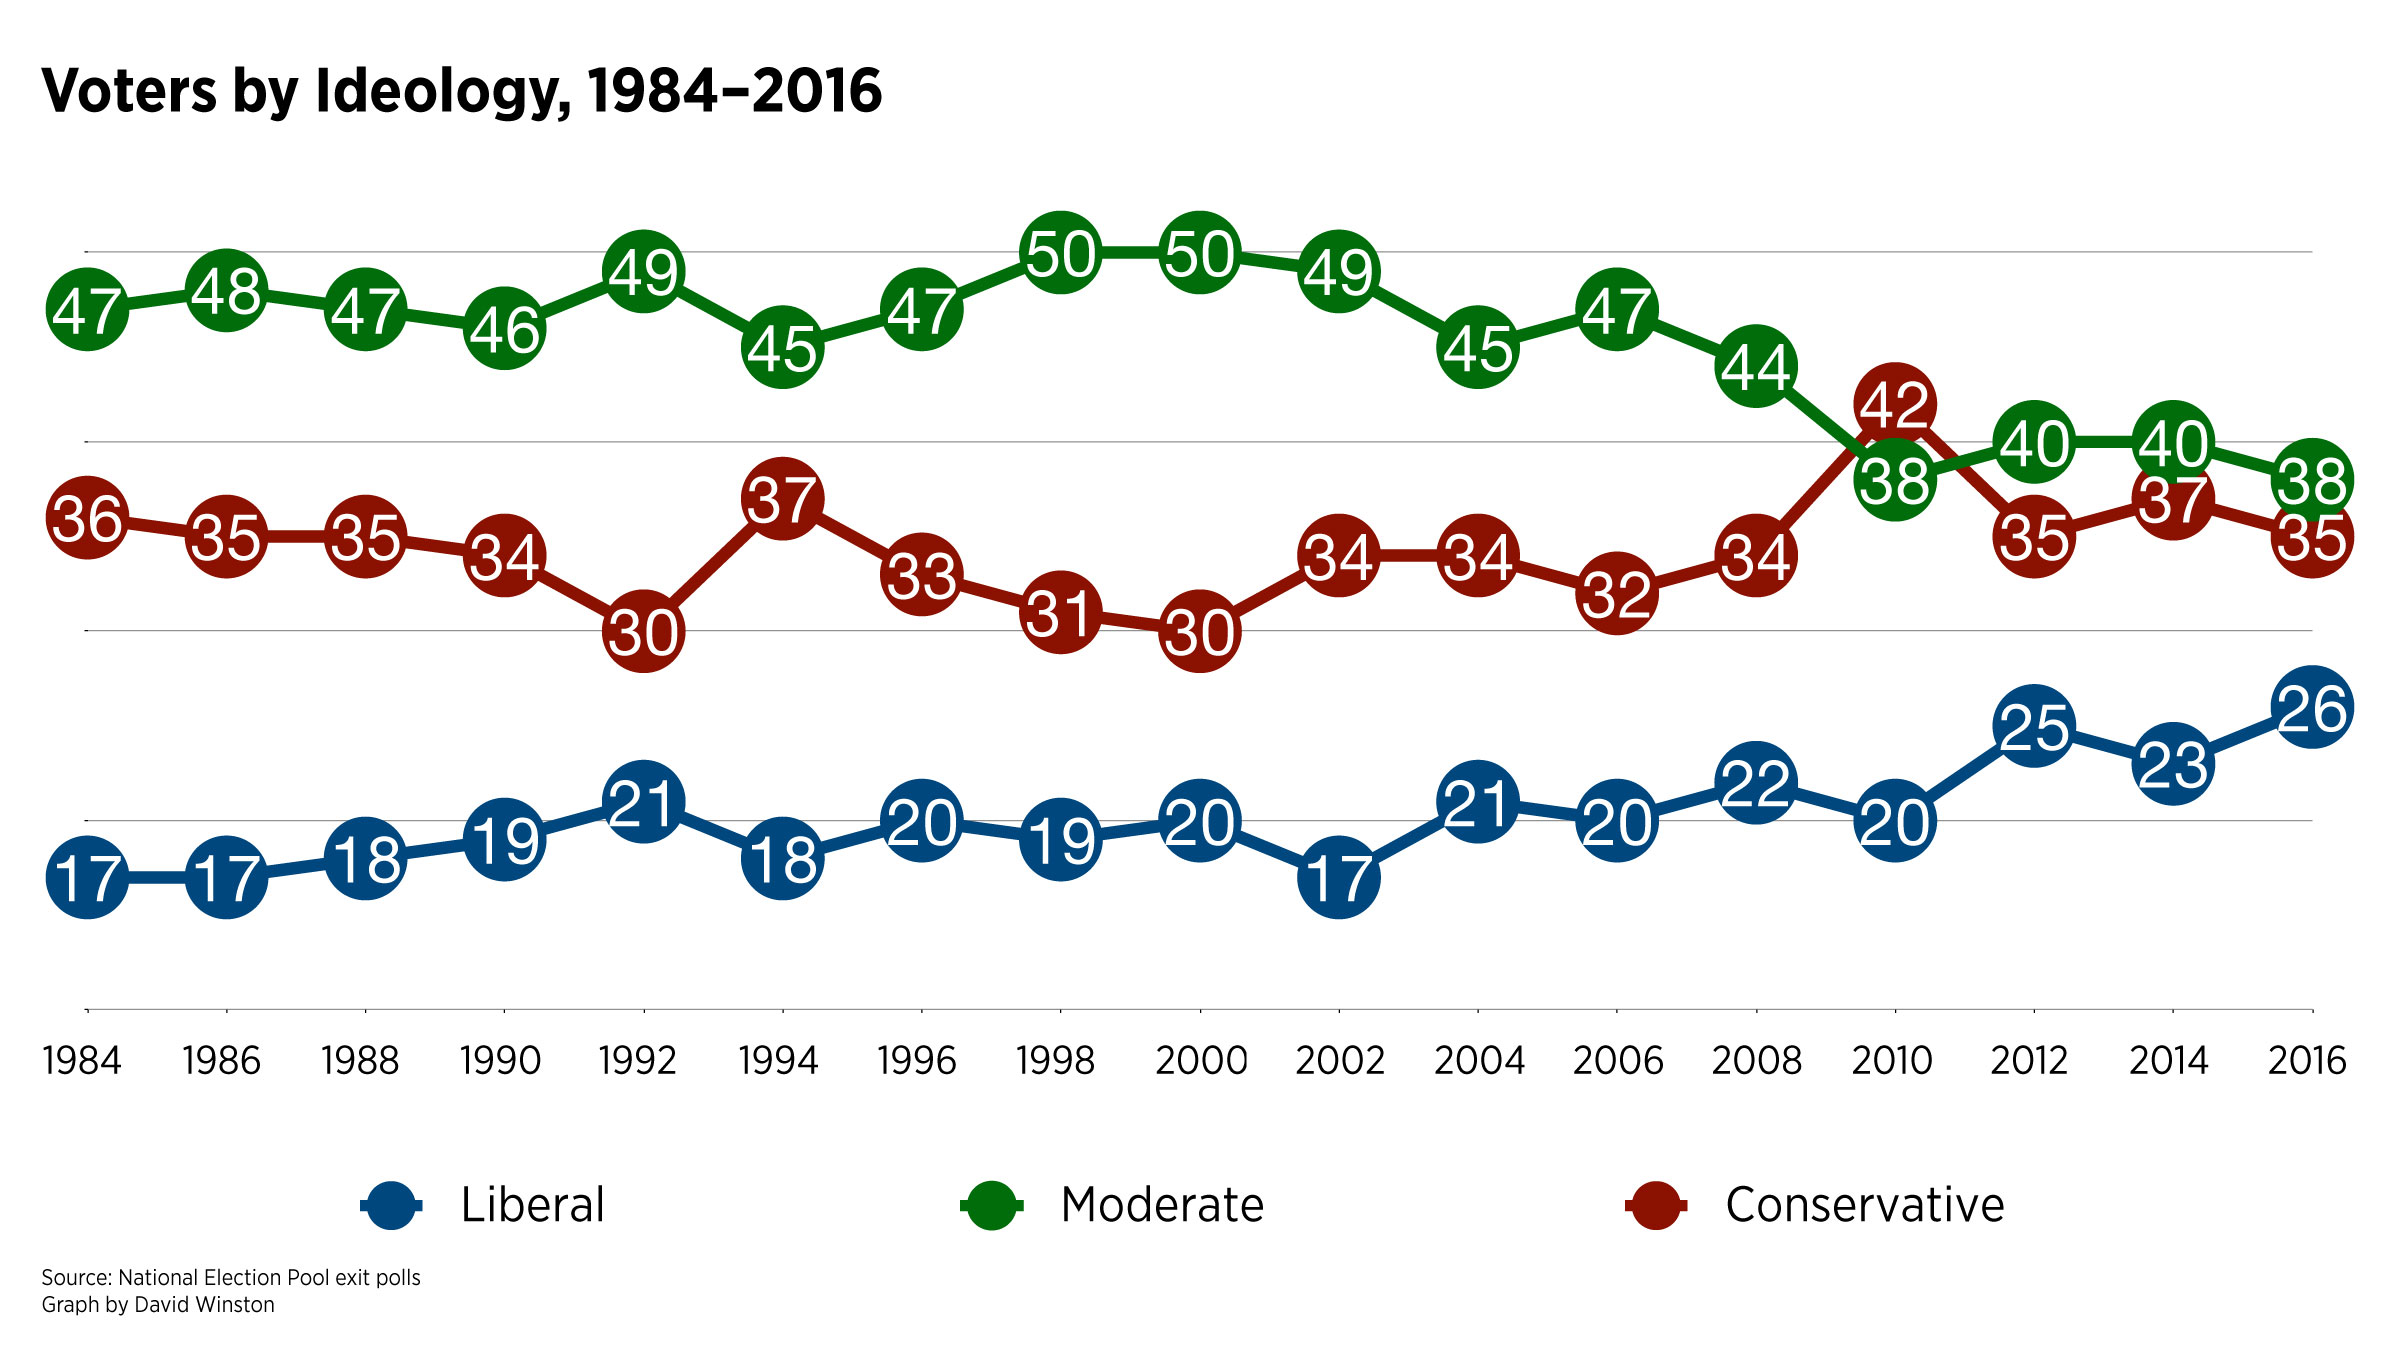
2. What is ideology looking like?
Similar to party identification, the ideological composition of the electorate will be another key marker. Over the past few elections, we have seen a slight uptick for liberals. Next Tuesday, as exit poll data comes in, we’ll be able to see whether, and to what extent, the liberal upward trend continues and whether conservatives stay at their historical mid-30s level.
In a typical election, moderates usually outnumber both conservatives and liberals. However, 2010 was the one exception to that rule when conservatives (42 percent) outnumbered moderates (38 percent). Whatever the trends, voter ideology identified in the exit polls will give us an early clue about the final outcome.
3. Are there other key groups in the electorate with unusual turnout, and who are they?
One of the key groups to pay close attention to is young voters. They typically make up somewhere in the range of 12 to 13 percent of the electorate in an off-year election as we saw in 2006, 2010 and 2014.
In the last three presidential elections, these younger voters have made up 18 to 19 percent of the electorate. Will this finally be the year that young voters surge as a percentage of the off-year electorate and come closer to their presidential-year participation?
There could be other groups that pop, but I would keep a particular eye on young voters. There has also been significant discussion about female voters. They ranged from 51 to 52 percent in the last three off-year elections, but in 2012, the percentage was higher at 53 percent. The key takeaway is women are the majority of the electorate, but will their majority status expand in this midterm election?
4. How are independent voters breaking?
As I’ve said in previous columns, whether this will be a wave election depends on the scale at which independents are breaking, as we’ve seen in previous waves. In 1994, Republicans won independents by 14 points; in 2006, Democrats won them by 18; in 2010, Republicans won them by 19. Up to this point, I have seen few surveys that show independents breaking by double digits in either direction. With 42 percent of independents having an unfavorable view of both parties, they could decide late in the game and still break heavily one way or the other. They did in 2016.
Other factors to remember election night
It’s important for election watchers to understand that exit poll data is reported from the field in three waves and isn’t designed to predict election results but rather to point to demographic and other trends in the data. Making predictions based on early data can lead to big miscalculations. Just ask President John Kerry.
In 2004, when the first wave of exit polling data unfortunately became public, the internet went crazy reporting that Kerry was likely to be the next president according to “early” exit polls. What analysts and pundits forgot was that there were two waves of interviews yet to come so their predictions were made on a very incomplete sample.
As a final note, brace for a very long evening, maybe even an all-nighter. California has several close House races which means the battle for the majority could extend into the next day. Given many of the recent surveys in competitive House districts across the country, there are also likely to be races that will be too close to call election night, with some even going to recounts.
If there is a blue wave, people may get a good night’s sleep. But if this turns out to be a nail-biter of an election, what happens in California could determine who takes control of the House, and polls there don’t close until 11 p.m. Eastern time. Some states will come in early, around 7 p.m. Look for races that are viewed as competitive but that are significantly leaning in one direction. If they are called quickly, that could be an indicator of what kind of night we’re in for.
The 2018 midterm elections may go down as an election for the ages — with or without a blue wave. I’m guessing there will be plenty of drama and maybe big disappointments. But for political junkies, it doesn’t get much better than this.
David Winston is the president of The Winston Group and a longtime adviser to congressional Republicans. He previously served as the director of planning for Speaker Newt Gingrich. He advises Fortune 100 companies, foundations, and nonprofit organizations on strategic planning and public policy issues, and is an election analyst for CBS News.


